Following my previous post on general elections in the UK, I decided to collect a bit more information. This time I am going to be look at by-elections in the UK from 1950 to present.
To collect information on By-elections I had to scrape it from wikipedia, mainly these pages, and links within them. Due to incomplete entries and inconsistent formats between pages the scrapped data is sometimes incomplete for the breakdown of votes. If anyone knows a better source, please let me know. The scrapped data can be found here.
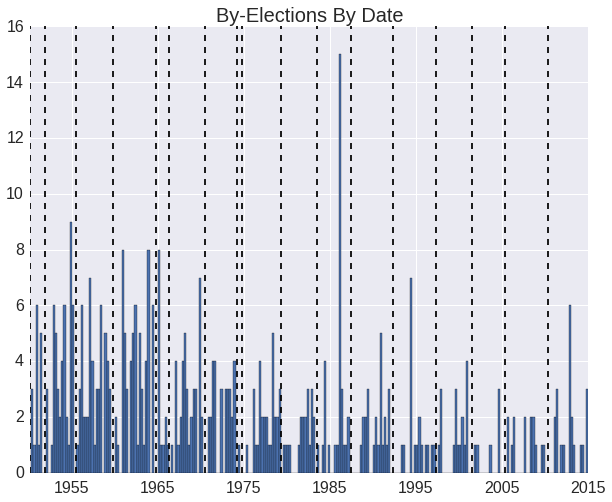
Over the past 65 years, there have been 440 by-elections in the UK. We can ask how they are distributed in time:
Here the black dashed lines show the dates of general elections, and the blue bars show the number of by-election in a given time frame. The highest point is from the start of 1986 and due to multiple MPs resigning and seeking re-election in protest of the Anglo-Irish Agreement.
Causes
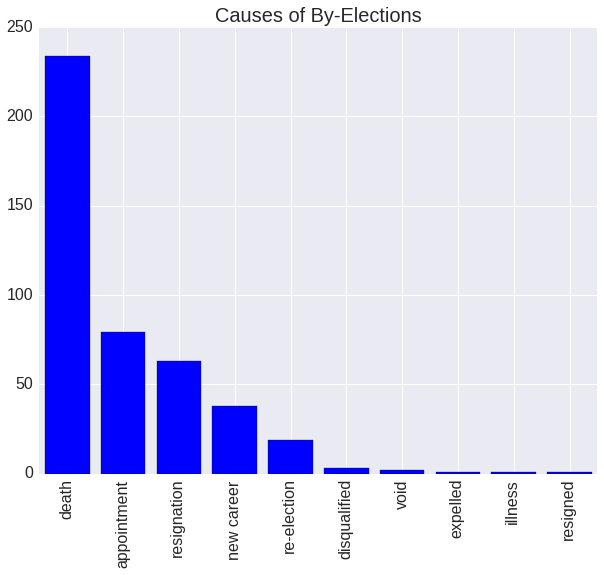
We can also ask what causes a by-election. In rough categories the breakdown is given by
Showing that death is by far the biggest cause. We lose an average of 13 MPs per general election cycle.
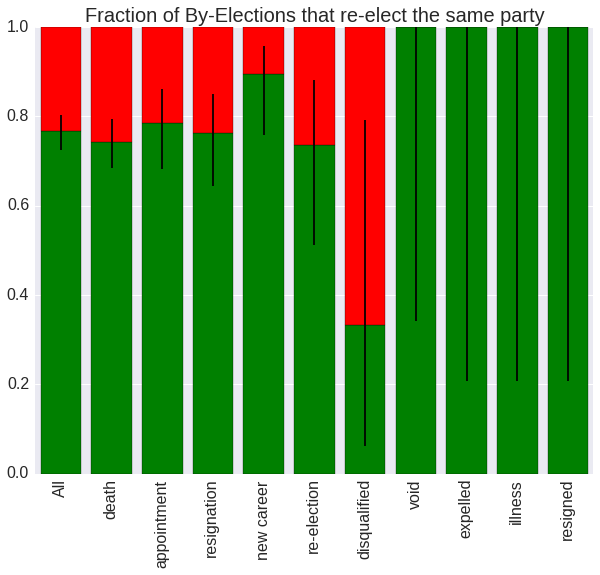
A question every by-election brings up is how often does a by-election return the same party as an MP. A breakdown of how often this happens is below.
Where the green bar shows the fraction of by-elections triggered for a cause that have returned an MP of the same party. The black lines of the graph show the confidence intervals we could place on each fraction, if we assumed the data was drawn from a binomial. My reason for doing this is to take into account the fact that the later cause happen so rarely that using them to draw any kind of conclusion is difficult.
Overall it does not look like there is a statistically significant difference between any reason. They always seems to be about 76% chance of returning the same party.
Turnout
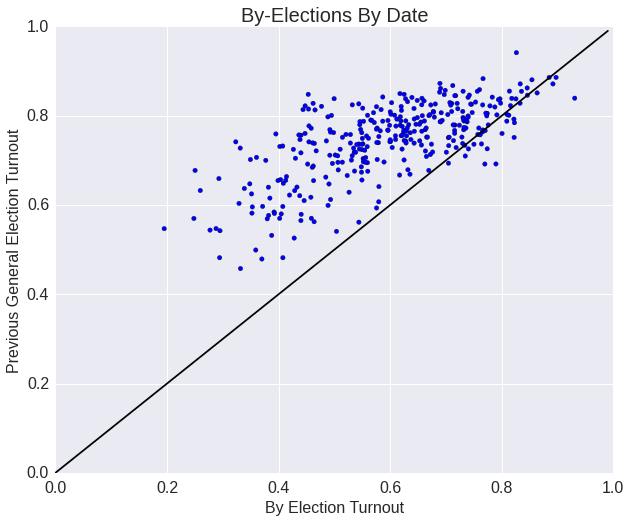
In a similar trend to my last blog post we can ask how the turn out for by-elections relates to the turnout of the preceding general election.
Not surprisingly, by-elections tend to have lower turnouts than general elections, but other correlate well.
How was it made
All graphs were produced in python using matplotlib and the seaborn package.


Comments !